1
Tonga
- ISO code
- TON
- Grams per person per day
- 429.95
- Kg per person per year
- 156.93
- Scope
- 2023 food-balance supply; FAOSTAT processed using OWID population
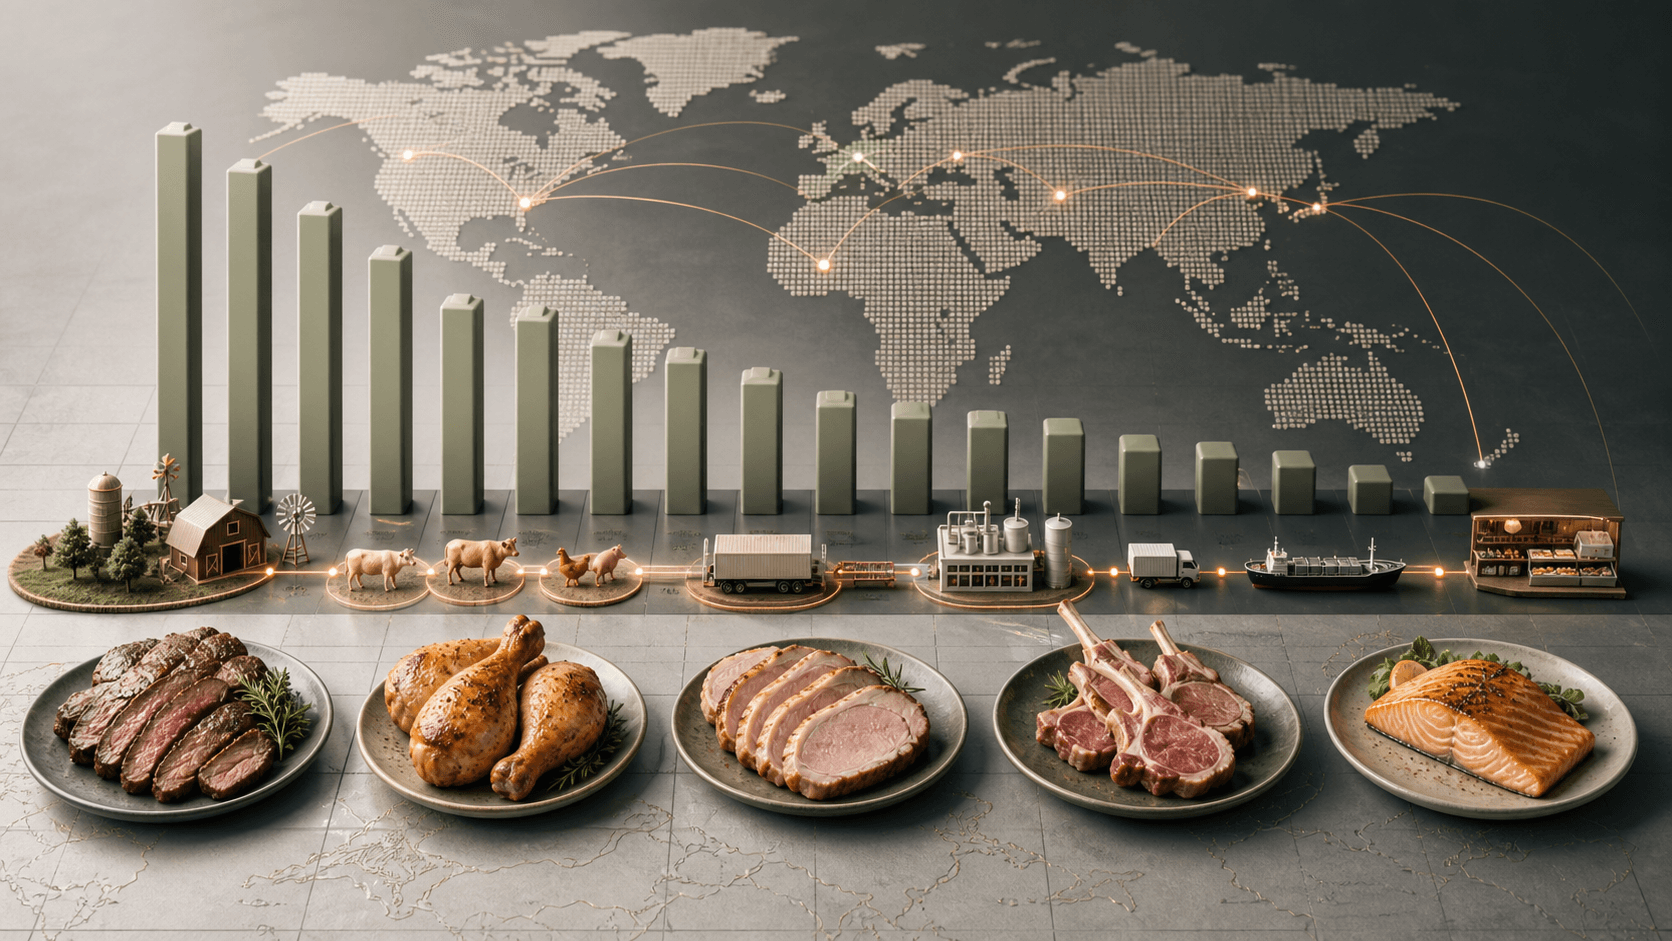
Country/area rankings from FAOSTAT food balances processed by Our World in Data for 2023. The metric measures meat available at the end of the supply chain before consumer waste, rather than observed individual intake.
Read the full OWID CSV and filter Year=2023 with a three-letter ISO3 code, retaining 176 country/area rows and excluding OWID aggregates. Sort unrounded daily grams and check the eleventh-place boundary. Round displays to two decimals; derive annual kilograms from unrounded grams × 365 / 1,000. OWID reconstructs FAOSTAT totals then applies its own population denominator, so this is not interchangeable with direct FAO per-capita series. The update dated 25 February 2026 uses the October 2025 FAO release with eleven missing countries filled from an earlier release. Distinguish the data year from actual retrieval.
References: 2. Page edits do not imply that the underlying data is newer.
All ten identities, daily values and annual conversions match the dataset. Tonga records 429.94656 grams per person daily, equivalent to 156.93 kilograms annually. Belarus is tenth at 306.0822 grams, followed by Nauru at 299.24966. Coverage is the 176 countries/areas reporting 2023 values.
No sign-in required. Feedback is reviewed before any content is changed. Limit: 5 per day.
Year=2023,176 个有 ISO3 代码的国家/地区,排除 OWID 汇总。前十逐行比对原始日克数与年千克数,第十一名瑙鲁为 299.24966 克/人/日。
数据更新 2026-02-25,覆盖至 2023。食品平衡表供给不扣消费者浪费;OWID 重新采用其人口分母。2025 FAO 版缺失的 11 个国家使用前版补齐,详见页面处理说明。
| Rank | Country / territory | ISO code | Grams per person per day | Kg per person per year | Scope |
|---|---|---|---|---|---|
| 1 | Tonga | TON | 429.95 | 156.93 | 2023 food-balance supply; FAOSTAT processed using OWID population |
| 2 | Mongolia | MNG | 372.99 | 136.14 | 2023 food-balance supply; FAOSTAT processed using OWID population |
| 3 | Marshall Islands | MHL | 344.16 | 125.62 | 2023 food-balance supply; FAOSTAT processed using OWID population |
| 4 | United States | USA | 334.41 | 122.06 | 2023 food-balance supply; FAOSTAT processed using OWID population |
| 5 | Macao | MAC | 332.13 | 121.23 | 2023 food-balance supply; FAOSTAT processed using OWID population |
| 6 | Saint Vincent and the Grenadines | VCT | 324.54 | 118.46 | 2023 food-balance supply; FAOSTAT processed using OWID population |
| 7 | Australia | AUS | 319.95 | 116.78 | 2023 food-balance supply; FAOSTAT processed using OWID population |
| 8 | Argentina | ARG | 314.93 | 114.95 | 2023 food-balance supply; FAOSTAT processed using OWID population |
| 9 | Bahamas | BHS | 314.81 | 114.91 | 2023 food-balance supply; FAOSTAT processed using OWID population |
| 10 | Belarus | BLR | 306.08 | 111.72 | 2023 food-balance supply; FAOSTAT processed using OWID population |
Rank changes are shown only for verified data editions with the same metric, scope and methodology.
Comments